Visualizing the Results of Profiling Python Code
If you've ever profiled a Python program, you probably know about the
cProfile module in the standard library. Examining the output of
cProfile is not easy, as it requires you to remember incantations like
p.sort_stats('time').print_stats(10). And if you see that a lot of time is
spent in some function deep inside numpy, you'll have a hard time figuring out
who exactly is calling that function. Fortunately, there are some good
visualization tools out there. I will describe two of them: pyprof2calltree
and pyinstrument.
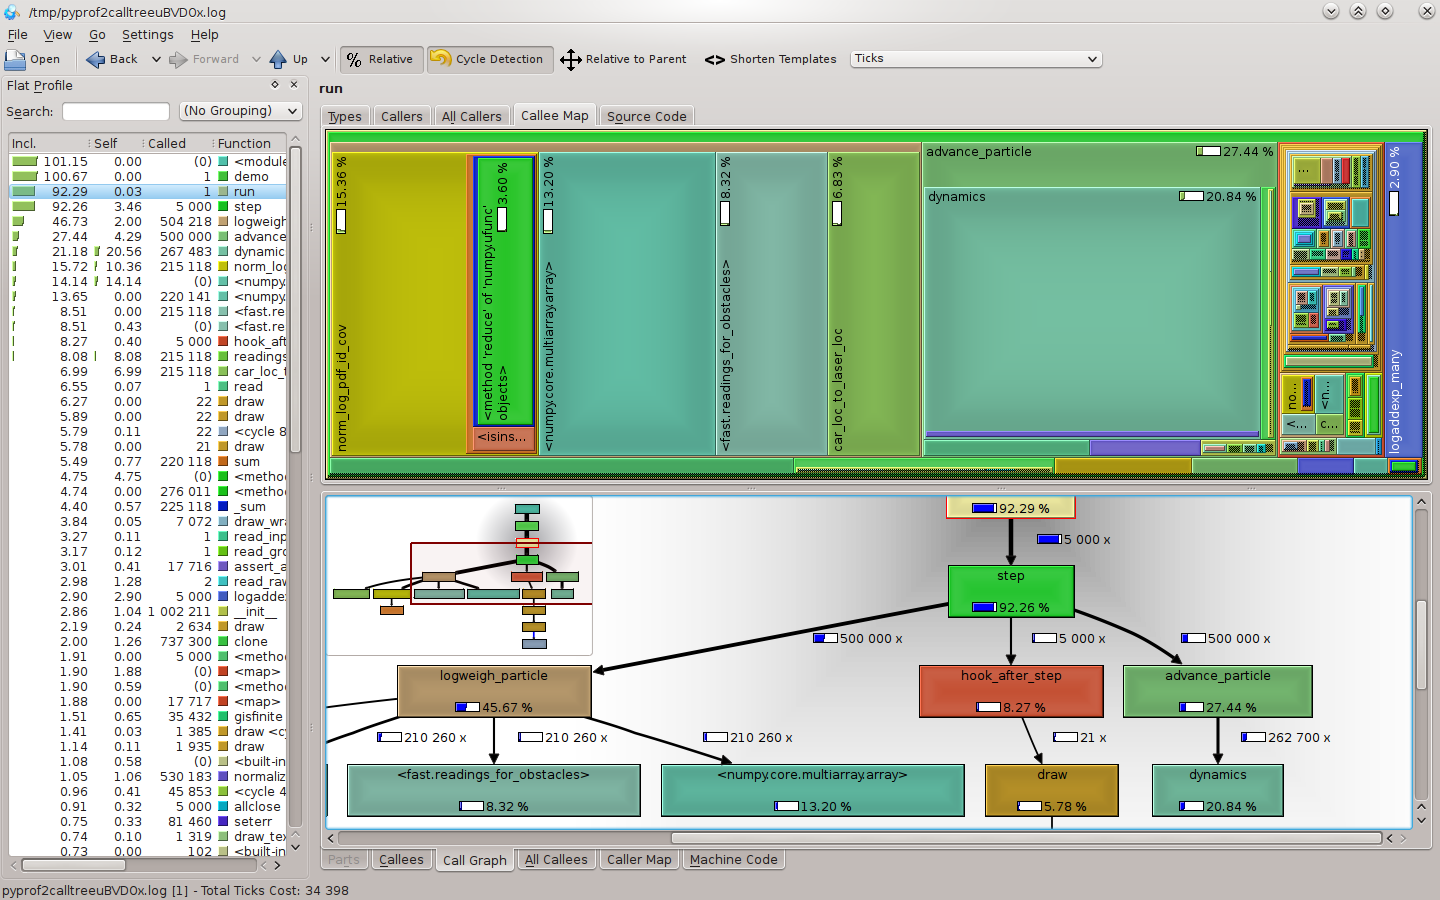
pyprof2calltree allows you to visualize cProfile
results using KCacheGrind, which might be familiar from your C days. Install it
with:
pip install pyprof2calltree
Profile your program as usual:
python -m cProfile -o prof.out mycode.py
Then visualize the results in KCacheGrind:
pyprof2calltree -i prof.out -k
This gives you a visualization of the call graph, and how much time is spent in each function:
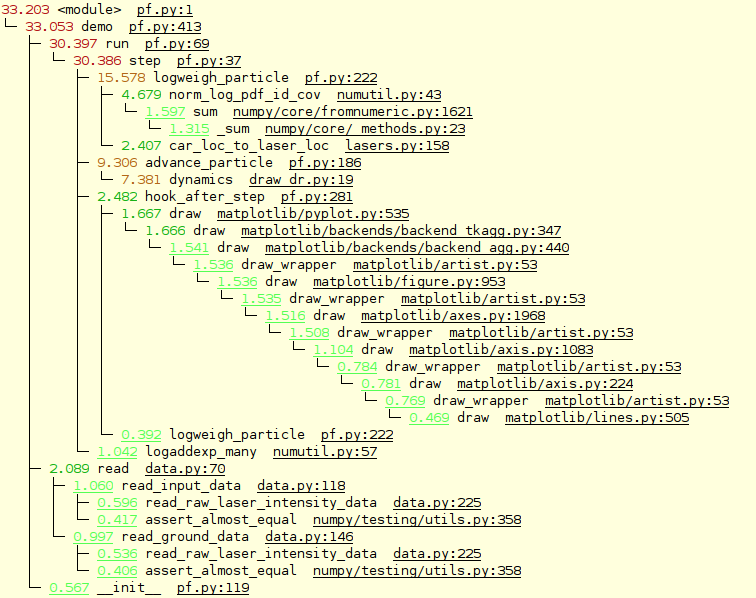
The other tool, pyinstrument, works entirely on the
command line. Install it with:
pip install pyinstrument
Run your program like this:
python -m pyinstrument mycode.py
And you get a nice color-coded call tree that tells you where the time is spent:
I really like the simplicity of pyinstrument, and I think it will become my
go-to Python profiler from now on. The only problem I noticed was that
pyinstrument seems unable to track time spent in C-extension calls, so if you
have any Cython code, you will not see how much time is spent there. (cProfile
+ pyprof2calltree don't seem to have this limitation.)